Weather Prediction Using Sequence to Sequence Reccurent Neural Networks
Mohammad Alhusseini
Runxiong Dong
Project Goal
The aim of the project is to utilize deep learning for time series weather prediction. We use multi-layered Recurrent Neural
Networks for training and predicting using weather data for three cities.
Recurrent Neural Networks
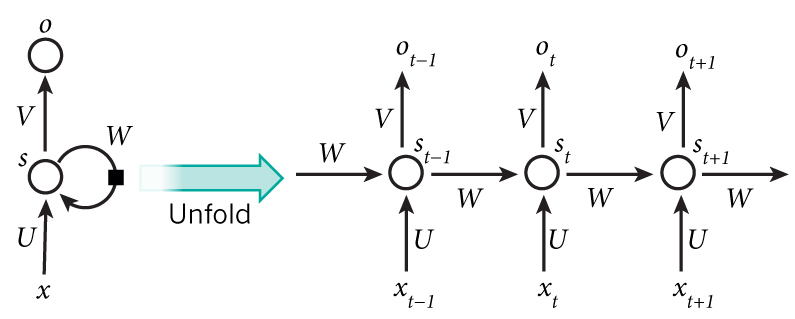
Recurrent Neural Networks (RNNs) are a class of neural networks designed to process sequential data. An RNN can be thought
of as the addition of loops to the architecture of a standard feed-forward nerual network. For a fixed length input
vector, the RNN can be unfolded from a recursive computation into a repetitive structure. This unfolding can be seen
in the computation figure below.
Figure 1: A recurrent neural network. The network processes information from the input x to a state W that is
passed forward through time.
(L) Circuit diagram.
(R)
The same network unnfolded, where each node is now associated with a single time step.
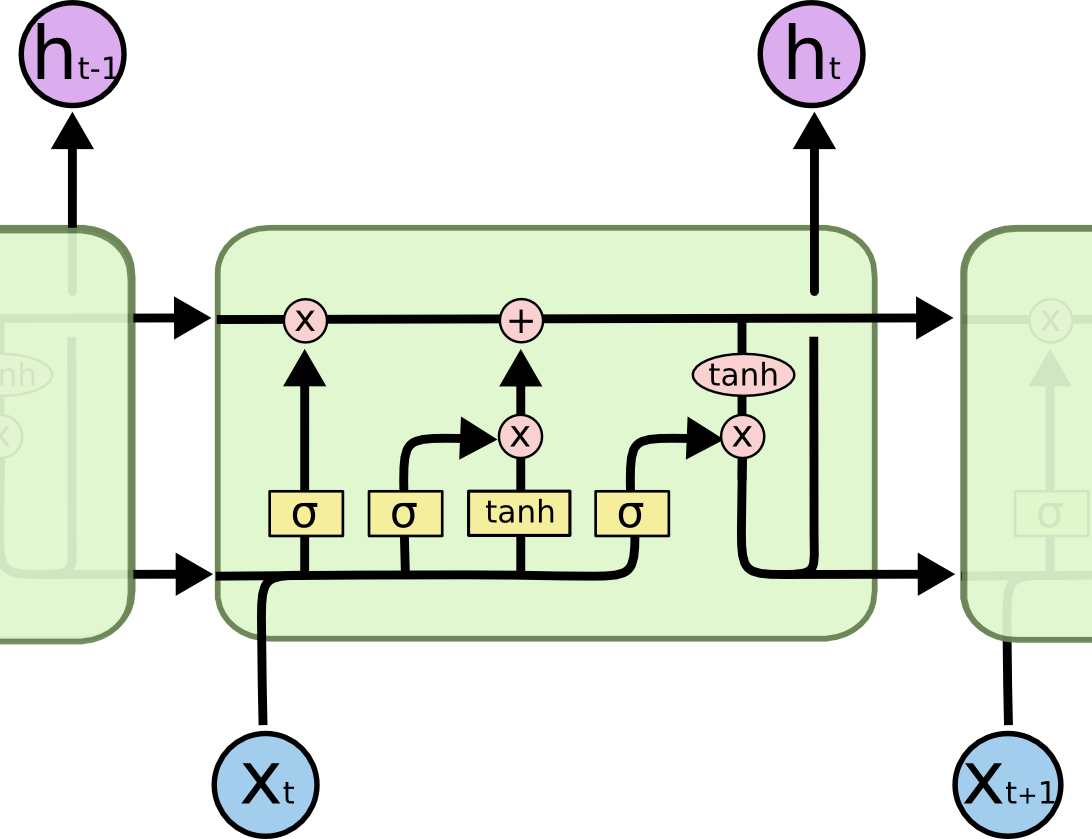
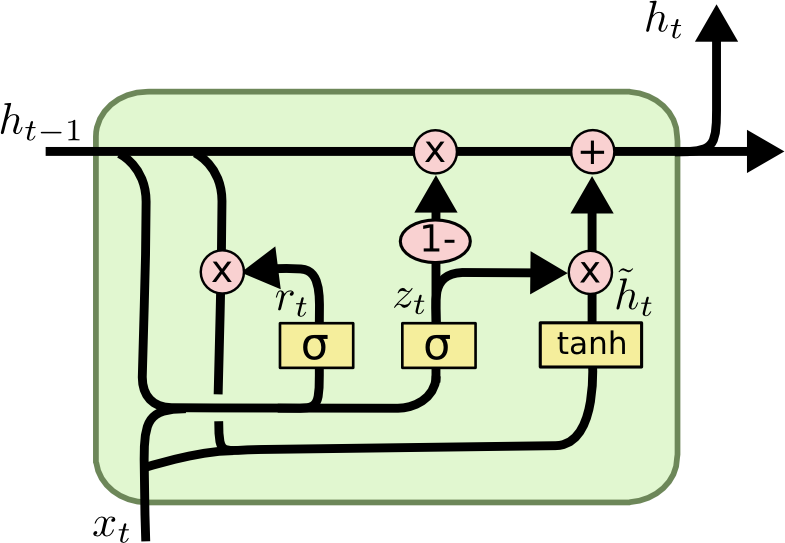
The most effective sequence models are called gated RNNs, which are capable of learning long-term dependencies. These
include the Long Short-Term Memory (LSTM) and Gated Recurrent Unit (GRU). Gated RNNs are based on the idea of creating
paths through time that have derivatives that do not vanish. The main difference between LSTMs and GRUs is that in
the latter a single gating unit simultaneously controls the forgetting factor and the decision to update the state
unit. The resulting model is simpler than standard LSTM models, and has been growing increasingly popular.
Figure 2:(L) LSTM RNN Cell.
(R) GRU RNN Cell.
Model
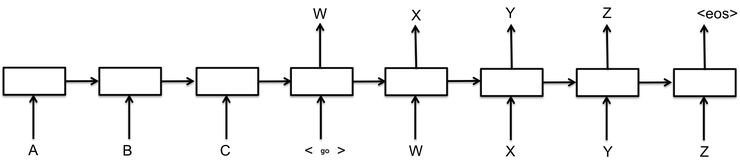
The sequence to sequence (seq2seq) model contains two RNNs, e.g. GRUs or LSTMs, that act as an encoder and decoder. The
encoder processes the input sequence, and encodes them into a fixed length vector - the hidden state of the last encoder
RNN. This vector is then passed to the decoder, which decodes it into the output sequence - expected values. The diagram
below shows a model of the seq2seq model used for machine translation.
Figure 3: In this example, a seq2seq model has an input sequence of size 3, and an output sequence of size 4.
It reads the input sentence "ABC", and produces the output sentence "WXYZ" For our model, we set the input size and the output size to be an equal
N number of days. For each day in the training set, the model gets the previous
N days as input, and outputs the prediction for the next
N days.
Dataset Details
The weather dataset comes from the National Oceanic and Atmospheric Administration (NOAA). The data we used for this
project was recorded by weather stations at Los Angeles, Las Vegas, and Phoenix. The choice of cities was based on
geographical proximity and reliability of the weather station records. The weather stations are located at Los Angeles
International Airport, Phoenix Airport and McCarran International Airport. The downloaded data has the following features:
Air Temperature
TAVG: average temperature
TMIN: minimum temperature
TMAX: maximum temperature
Precipitation
PRCP: precipitation (rain)
SNOW: snowfall
Wind
AEND: average wind speed
WDF2: direction of fastest 2-minute wind
Weather Type
WT01: Fog, ice fog, or freezing fog (may include heavy fog)
WT02: Heavy fog or heaving freezing fog (not always distinguished from fog)
WT03: Thunder
WT04: Ice pellets, sleet, snow pellets, or small hail
Data Selection and Processing
The data we downloaded for the 3 cities starts from 1/1/1995 until 4/20/2018. We chose to only use data starting from
1/1/2000 for our project, since dates before that were often missing values for one of the cities. The daily variables
we chose to train on and predict are AWND, TMAX, TMIN, PRCP, and WDF2. TAVG was dropped since it was not recorded for
47% of the days across the 3 cities, so it would severly limit our usable data range. The SNOW variable was dropped
because it only snowed in Las Vegas for 3 days in the whole dataset, and never snowed in Phoenix or Los Angeles. The
variable SNOW should thus always be predicted as 0 due to the climate for these cities. The weather type data was dropped
for the same reason. Next, we normalize the variables for each city according to the forumla:
The following is a plot of the variable TMAX for Los Angeles across 28 days
Experiments
We trained the network using both GRU and LSTM cells, and it was observed that there is no benefit of using GRU over LSTM
in training and validation losses. Therefore, our final implementation in Keras uses LSTMs for the encoder and decoder
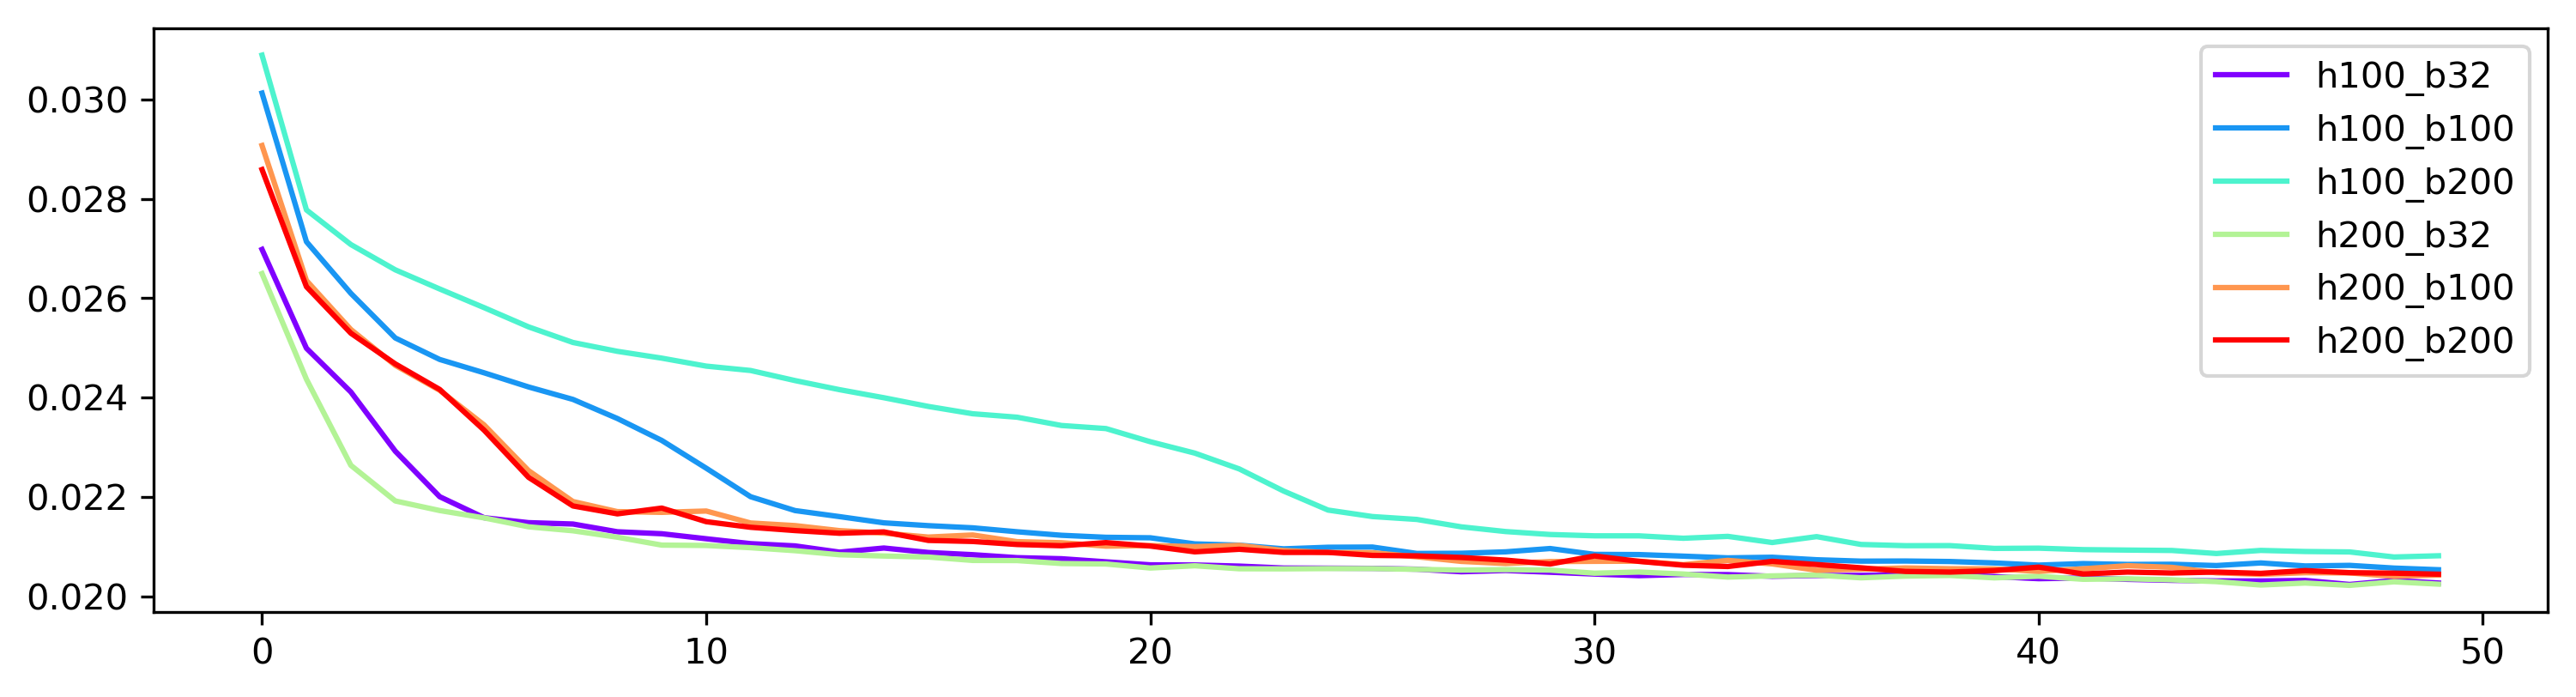
RNNs. We tried different combinations of network parameters, and used the Adam optimizer to train our model. The following
plot shows how the parameters affect our training loss over time. The format of the legend is hN_bM; where N is the hidden
layer size, and M is the training batch size
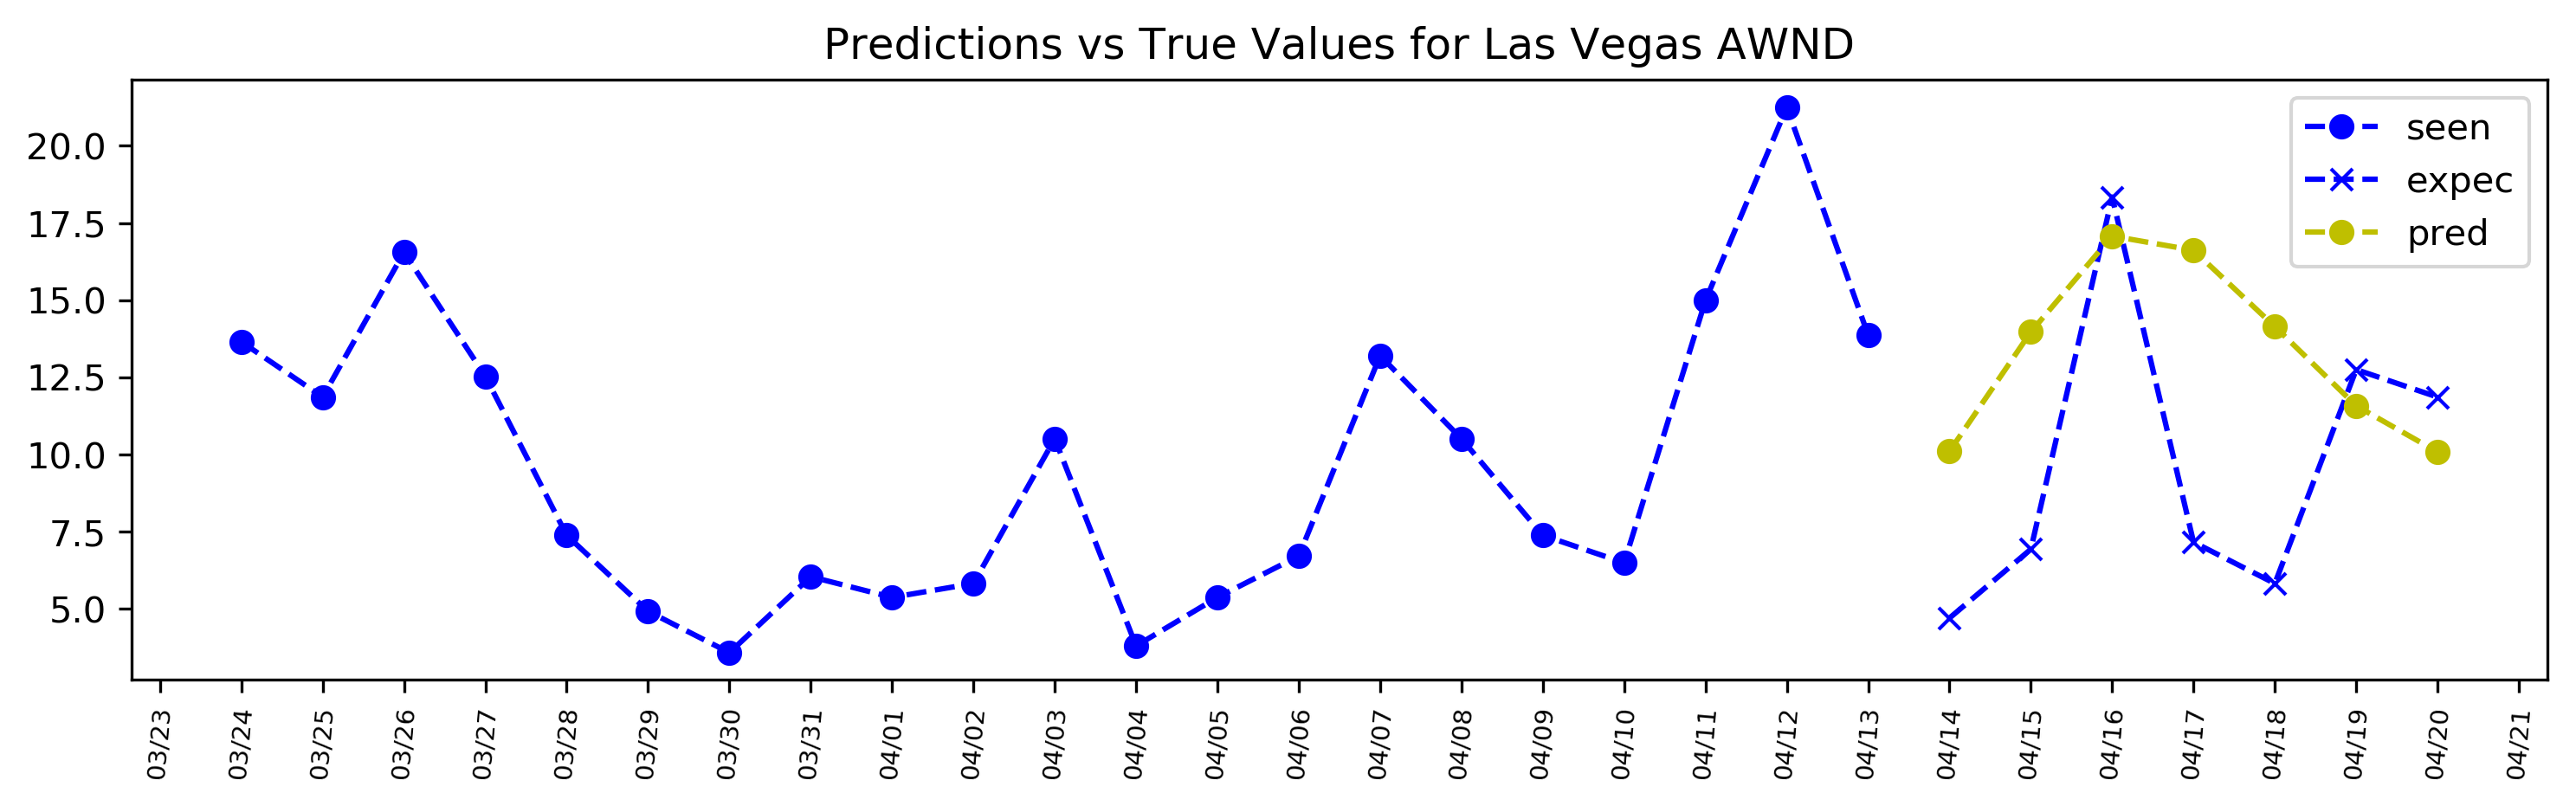
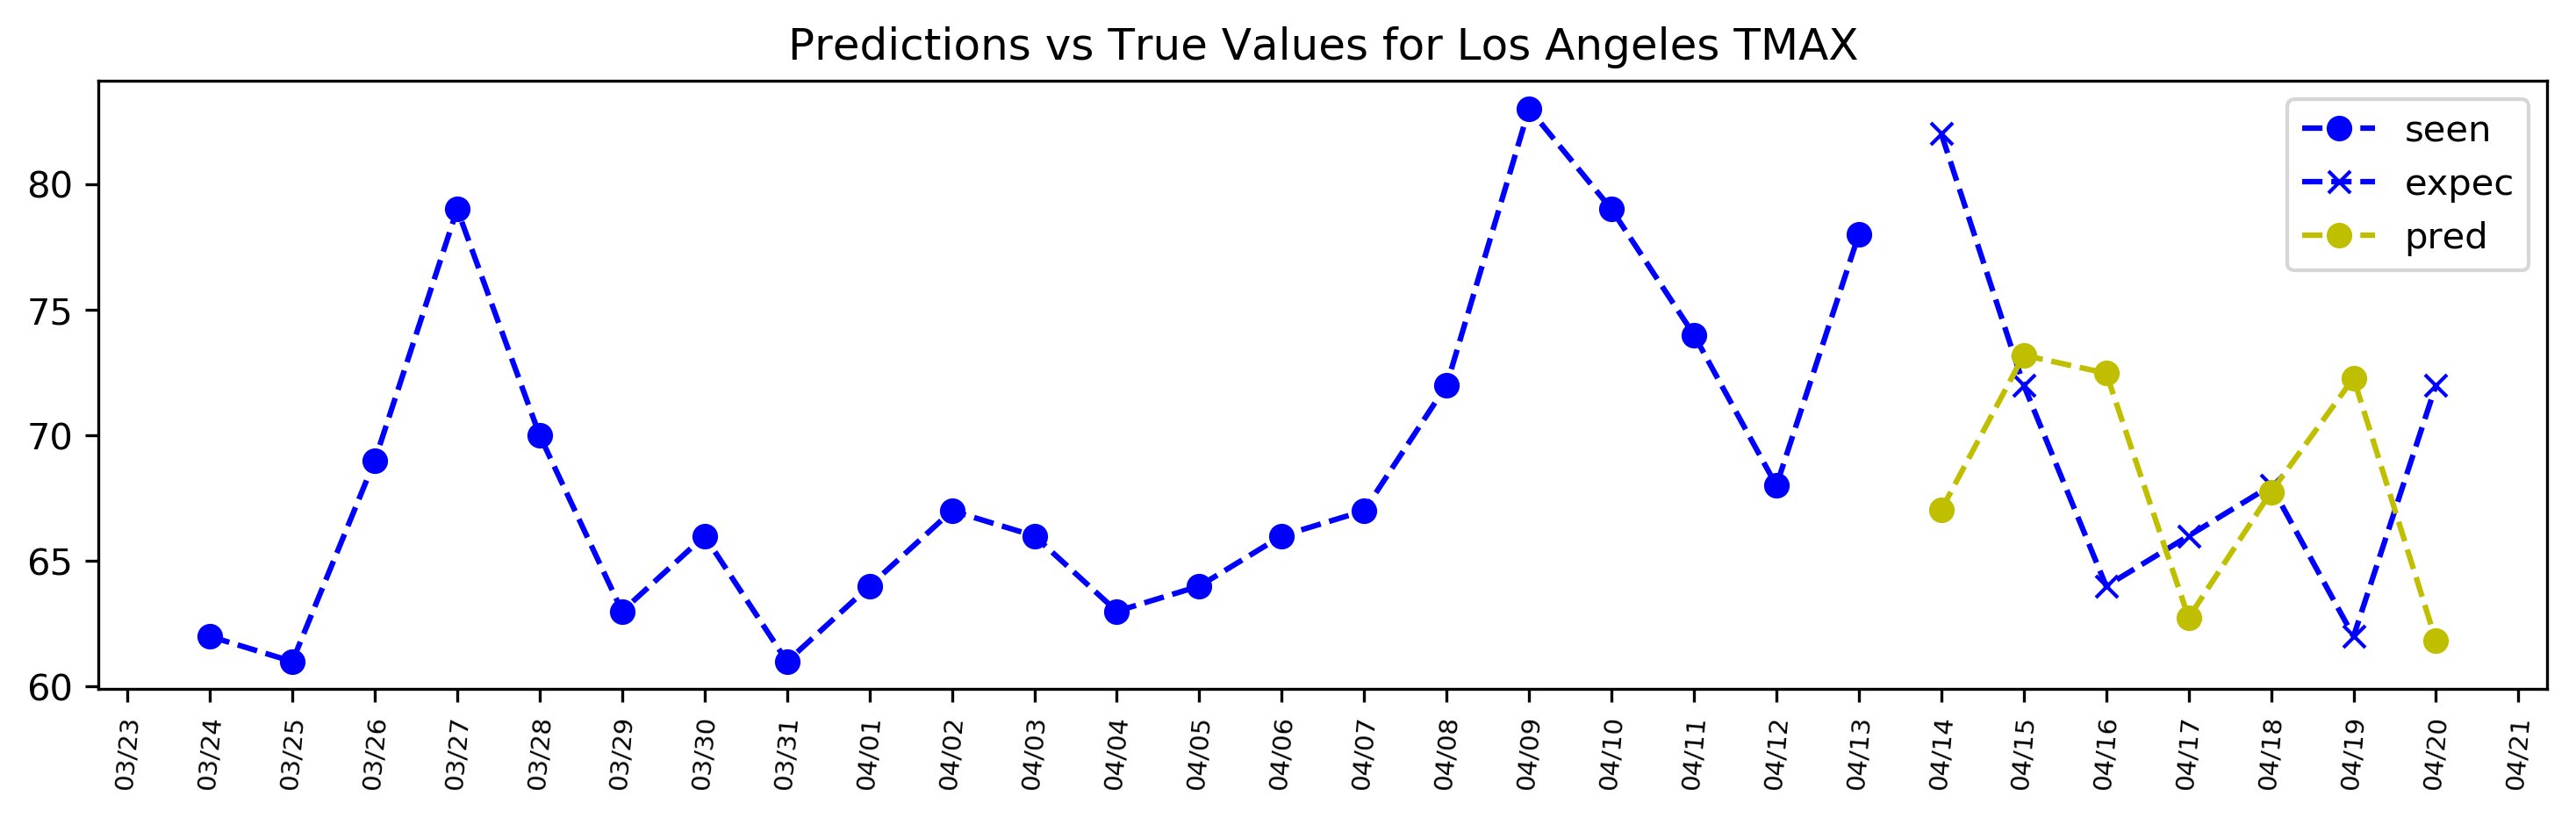
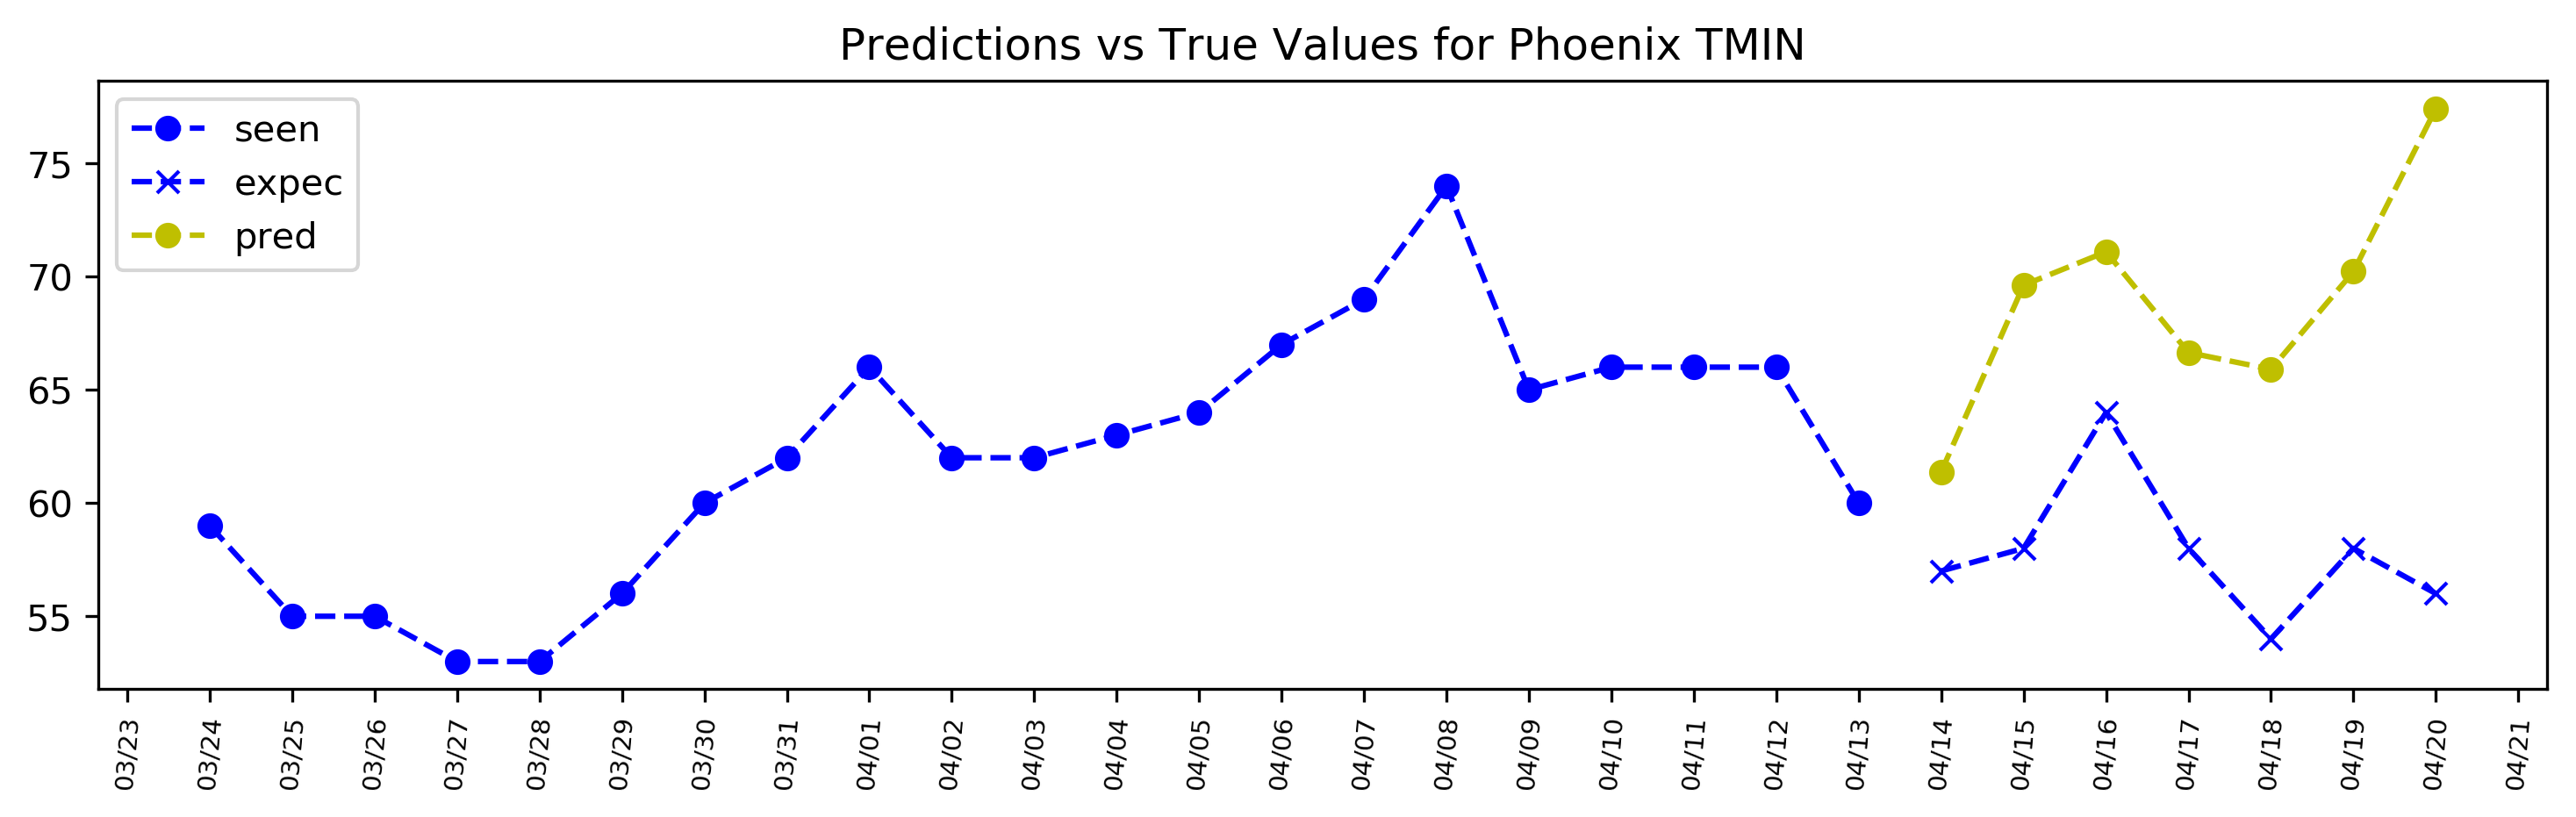
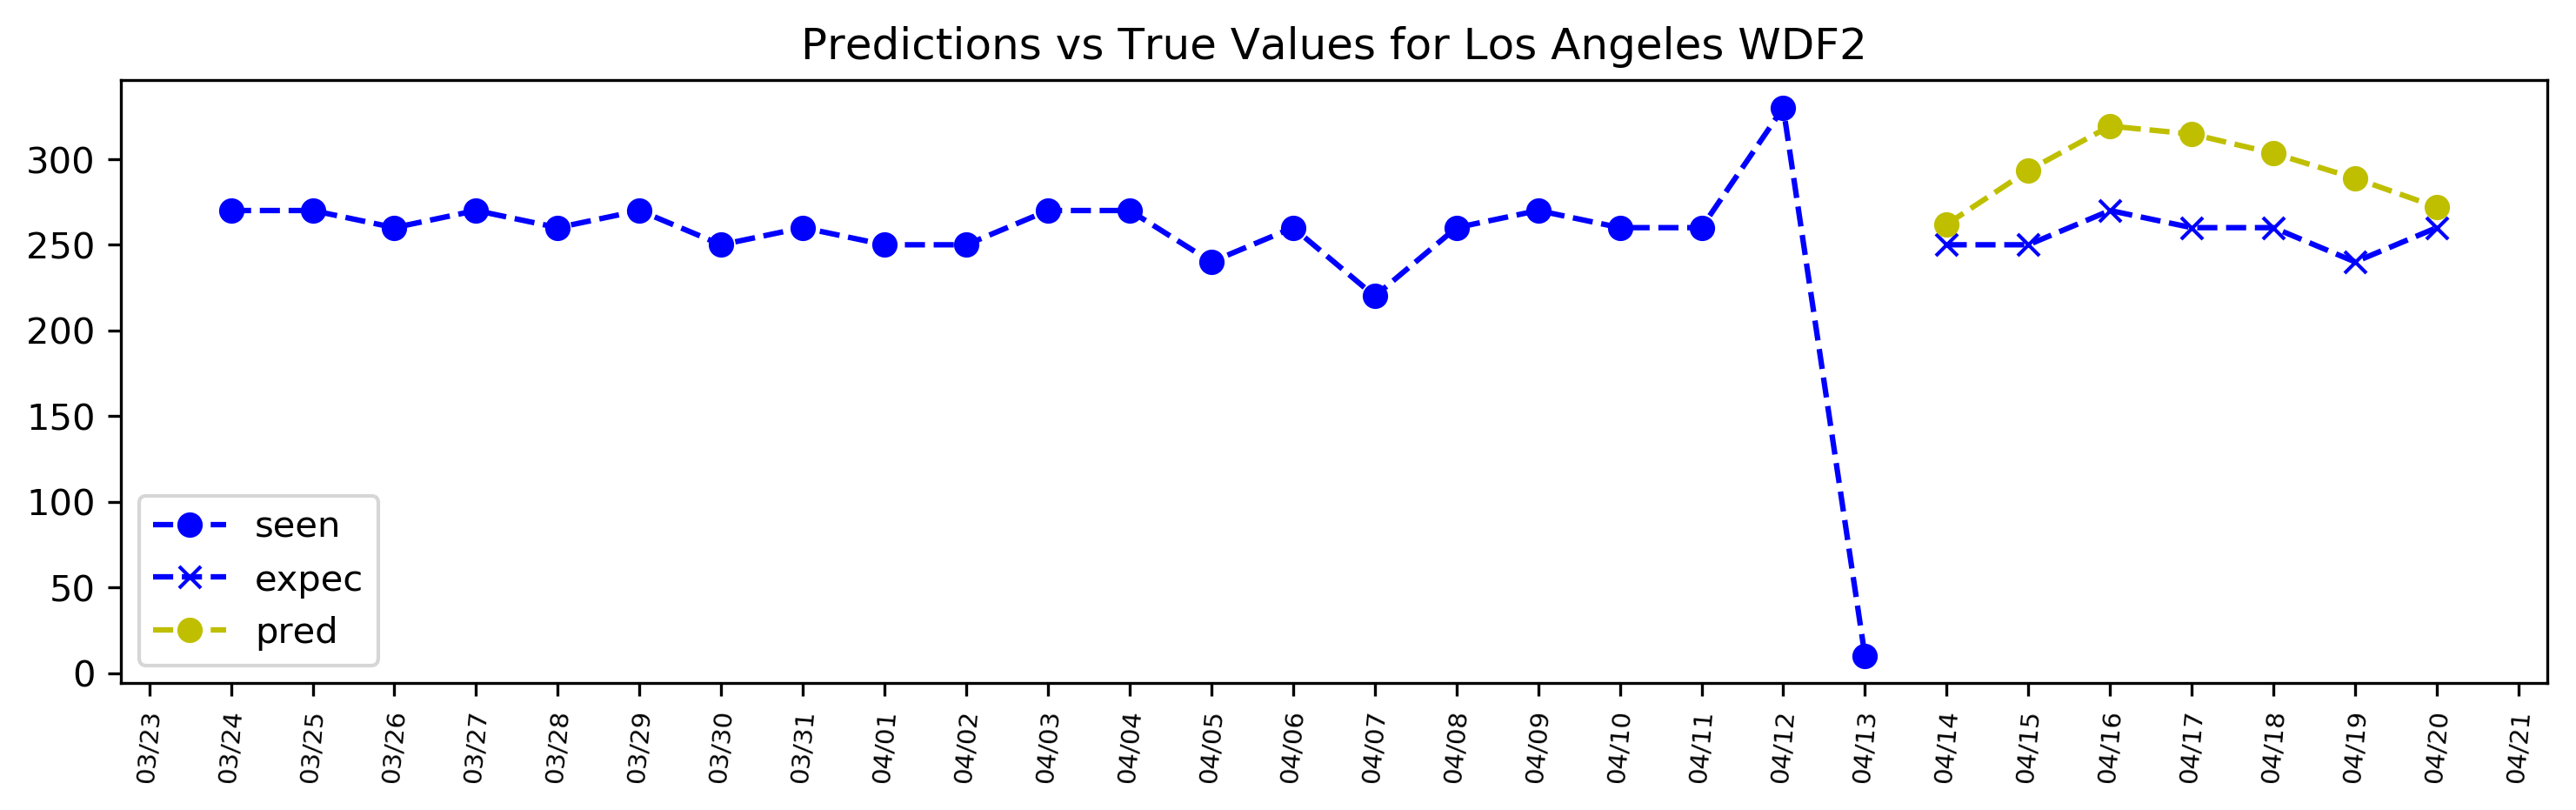
Predictions
The following are predictions for different features in different cities that our model predicted. The model predicts all
12 features simultaneously. These predictions are based on an input of 21 days, from 3/4/2018 to 4/13/2018. The model
then predicts what the conditions are for 4/14/2018 through 4/20/2018.
Conclusion
The results of this project show that Reccurent Neural Networks can be used to forecast general weather variables with a
good accuracy. The model we use can be improved with more computing power, as one would be able to use national or global
weather data on a longitude-latitude scale to capture the complex nature of weather movement. One can further include
doppler maps to predict how weather patterns move geographically. Deep Learning seems to offer a promising method for
weather forecasting that does not rely on complicated weather models and computation-expensive simulations.
Code and Data
Click
here to download the code.
The datasets we used can be downloaded as an archive
here. We made equal contributions to the code and the webpage.